At some point, when we are running our application in production, performance problems may happen.
Most of the time when our application starts to handle more traffic things start to break. An application designed to handle 5.000 requests a day, it’s not the same that can handle 500 million requests a day. Most of us should remember Twitter’s Fail Whale and the struggle to keep pace with its users and the sheer volume of tweets in the first years of the app.
When we are facing something like that, what should we do? Where do we start?
Observability
As our software evolves and the traffic grows, chances are that we will need to improve the performance of different parts of the system. To do that, first, we need to understand what the application is doing and explain why it behaves the way it does.
Observability is a term that states that your system needs to be observable and that you should have the ability to measure its internal state by analyzing its outputs, and to achieve that we have three main pillars: Logs, Metrics, and Traces.
Logs
Logs are normally the easiest way to start, almost all languages already have a built-in logger that you can use. The idea is to log events that happened in your application. This is very useful for debugging when something unexpected happens.
Metrics
A metric is a number captured at runtime that represents something in your system in a given timestamp.
Each application it’s different so it’s important to define what matters to us both on the operational side, and to the application domain, so we can start collecting metrics such as CPU usage, memory consumption, database query times, cache hits, cache misses, requests by second, users in real-time, etc.
All of this gives us context to better understand what’s happening in our application, and how the code behaves, instead of guessing how it should behave.
Traces
Traces are a series of events that tracks the progression of a single request. Each unit of work in a trace is called a span, and a trace is a tree of spans. Fancy, isn’t it? You might as well think of them as queues inside queues.
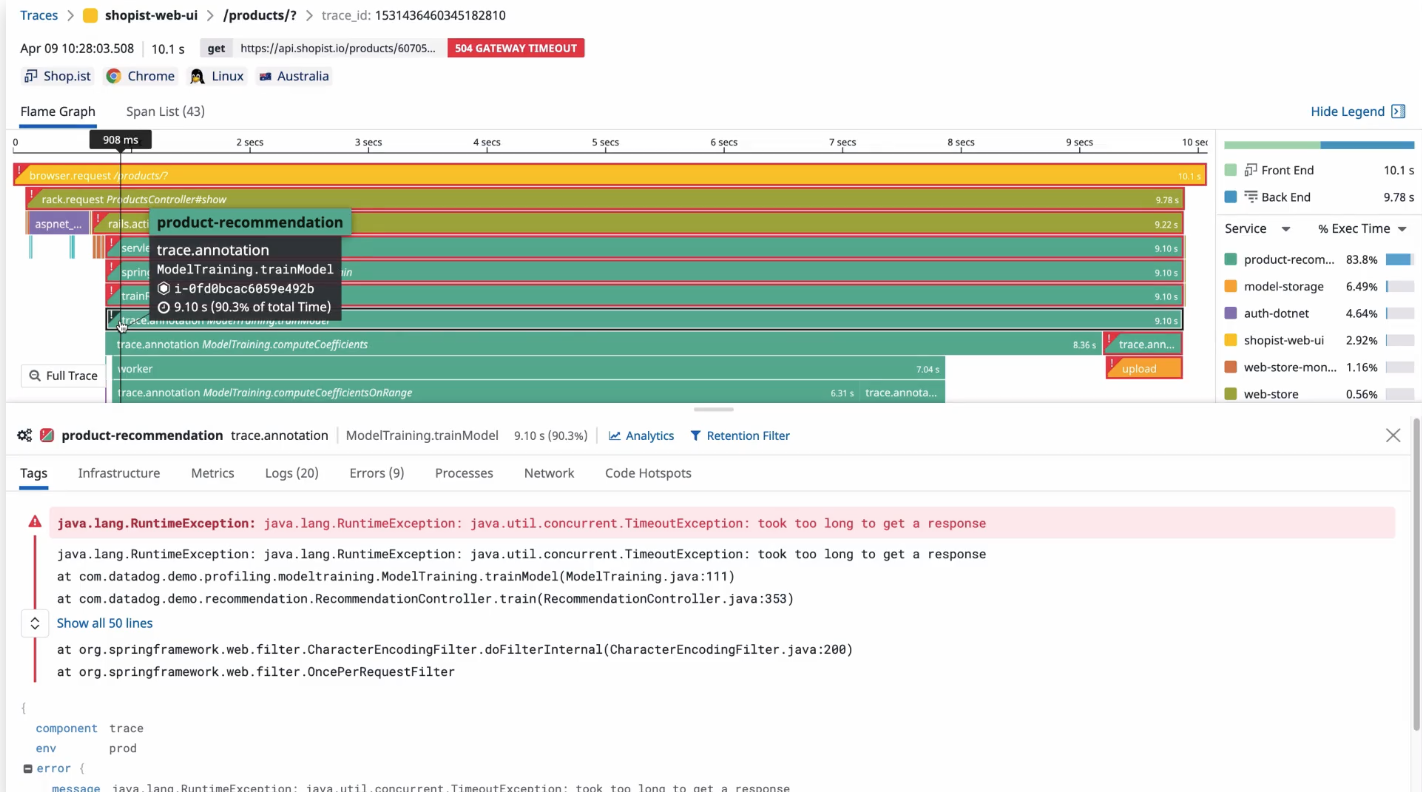
It gives us the ability to put into context what’s happening in our system. A trace represents the entire journey of a request as it moves through all the pieces of our applications. This can help us a lot, as it gives everyone the ability to understand and fix what’s wrong in the system.
Using it all together
Now that we talked about the three pillars of observability, we can start monitoring our metrics and how the changes we do in our application impact the performance.
To operationalize those metrics by creating alerts based on what matters to us, and monitoring the variability of these metrics is what allows us to react to a not-so-good deployment, to a new feature that needs to be improved, or to a system degradation that could happen over time.
Planning for overload
Performance is a feature, and there are systems that won’t need to worry about scalability at all. But given that we are dealing with an application that needs it, and that we already have our metrics and the visibility of what’s happening in the application. Where do we start?
One way to guarantee that your system can withstand the load it was designed to handle, and, with time, scale to manage the increased demand, it’s to simulate high loads. Keep in mind that even if you can simulate high traffic in your tests, sometimes, this will not be even closer to the production patterns. If that’s the case, the load test is still useful to the system but there are other options that could help us identify the system behavior in production, such as chaos engineering and feature flags.
We need to measure the system throughput and latency. The first represents the number of items processed per unit of time and the former represents the time between making a request to when you see a result.
A balanced system under heavy load results in a constant throughput. A system under overload becomes slow to respond, and when the latency increases the throughput decreases, and the queue increases. This could cause an outage.
Sometimes we need to put safeguards in place, ensuring users do not overflow the system with requests it can’t handle, this means that we will know how the system will fail, rather than let it explode.
Little’s Law
“In queueing theory, the long-term average number L of customers in a stationary system is equal to the long-term average effective arrival rate λ multiplied by the average time W that a customer spends in the system.” - Wikipedia
What it means is that the queue length (L), is equal to the arrival rate (λ), multiplied by the response time (W), and the formula is represented like
L = λW.
A different way to think about it is that a queue is made by the number of items inside the system (work in progress), the arrival rate being the number of requests made to the system, and the response time being the mean time an item takes to leave the system.
We can tweak this formula to calculate the number of items inside the system (Work In Progress) WIP = Throughput * Response time, the response time Response Time = WIP / Throughput, or the system throughput Throughput = WIP / Response time.
But why does it matter?
Have you heard the term overload before? It means that your system is having a hard time doing its tasks because the number of items arriving is greater than the number of items leaving. Remember Twitter’s whale?
If we don’t control this queue, it will grow exponentially and so will latency until all requests eventually start to fail. This will ultimately cause the service to run out of memory and crash. It will cascade to all callers causing failures throughout the whole system.

Most of the time we cannot control the arrival rate in the system, sometimes it could be constant such as a black Friday event, or it could happen through spikes of requests such as breaking news.
What we can control is the number of WIP items in the system by applying backpressure. We can also try to optimize the throughput, by removing bottlenecks from the request-processing path whenever possible.
If we don’t pay attention to those two, our systems can become unresponsive, overflowed with requests they can’t handle, degrade in performance, or crash altogether.
How do we protect our systems then?
Load regulation
Little’s Law can help us identify what’s the queue length desired to keep our system’s health in good shape. To determine the number of requests the system can service we can use the WIP formula (WIP = Throughput * Response time). Meaning that any request that exceeds the number of work in progress items allowed cannot be immediately serviced and must be queued or rejected.
Let’s think of one example to illustrate this in real life.
Cartola FC
Here in Brazil, we have an app, named Cartola FC, to play a football fantasy game. People can put together their teams and it’s based on the Brazilian National Football league. After every match, you will earn points based on how the players in your team are performing.
The app has 5.8 million active users, 2 billion app openings, and 238k requests per second. The traffic pattern is spiky, because people that have popular players on their teams, when this player scores a goal, all of them want to check the points at the same time, and sometimes it has 1 million simultaneous accesses.
To prevent degraded responses, after a certain threshold, they implemented a message saying “full stadium”, so the system doesn’t get overflowed with requests it can’t answer. They did this because normally after a refresh those who were waiting now will be able to see the partial results because people were only interested in checking its points, but they don’t stay for long.
Thinking about Little’s Law, the arrival rate is sky high, but the audience doesn’t stick around for too long during the games, by showing the message to the ones under the service threshold you assure that your users will get the response and the ones that aren’t able yet, will probably get a response next time they refresh the page.
It’s better to know how your system will fail, rather than let it explode. A degraded response, in this case, was a message telling the user to try again, but it could be returning data from a cache. It depends on your business need and how you will return a degraded response, but it’s important to think about one.
TL;DR;
We covered a lot of things in this blog post.
First, we did a recap about what’s observability and how you can use it to understand your system better.
By knowing how your system works, you can start planning for how it will behave under heavy load.
It’s necessary to define what matters to you and what matters to your domain. Always keep an eye on the metrics that are important, to know how the changes we implement in the code affect the performance. Those metrics together and the ability to create alerts that matter based on those metrics, it’s what allows us to react to a bad deployment, a feature that needs improvement, or system degradation.
To handle overload we need to identify first where to apply backpressure. It’s important to not overengineer the system that does not need load regulation. Use your system observability to decide where the optimizations should be.
Ask yourself: how many simultaneous requests can go through the system before latency becomes too high or the app runs out of memory?
Put safeguards in place, ensuring users do not overflow the system with requests it can’t handle. Know how your system will fail, rather than let it explode, and plan degraded responses that make sense to your business domain.
I hope it helps!
Related Links
- https://opentelemetry.io/docs/concepts/data-sources/
- https://netflixtechblog.medium.com/performance-under-load-3e6fa9a60581
- https://hipsters.tech/tecnologia-no-cartola-fc-hipsters-ponto-tech-232)
(pt-BR) - Designing for Scalability with Erlang/OTP: Implement Robust, Fault-Tolerant Systems
- https://keathley.io/blog/regulator.html